FRACTR: Fire Resource Area Coverage & Time to Response
Providing Vermont with a visual analysis of fire department response times and water resources in order to support regional emergency planning and public awareness


Why Are These Maps Important?
In the fire service, timing is key, and fire departments strive to respond as effectively and safely as possible with the goal of protecting life, property, and the environment. On any given call, even an increased response time of several minutes can have profound consequences on medical outcomes and fire growth. Additionally, fire crews who make it to the scene require access to the proper tools and resources to mitigate the threat (such as a nearby water source in the event of a fire). As a result, pre-incident plans, that includes maps of response times and water resource locations, should be accessible to fire departments, regional planning commissions, and local residents, giving them time to prepare for incidents in harder to reach areas and making it possible to identify sites where future fire stations can be built to maximize coverage.
The Map Building Process
- Fire Hydrants, Site Locations, Fire Dept. Emergency Service Zones, and State of Vermont boundary datasets are all collected from the Vermont Open Geodata Portal. Road data is provided by Open Street Maps.
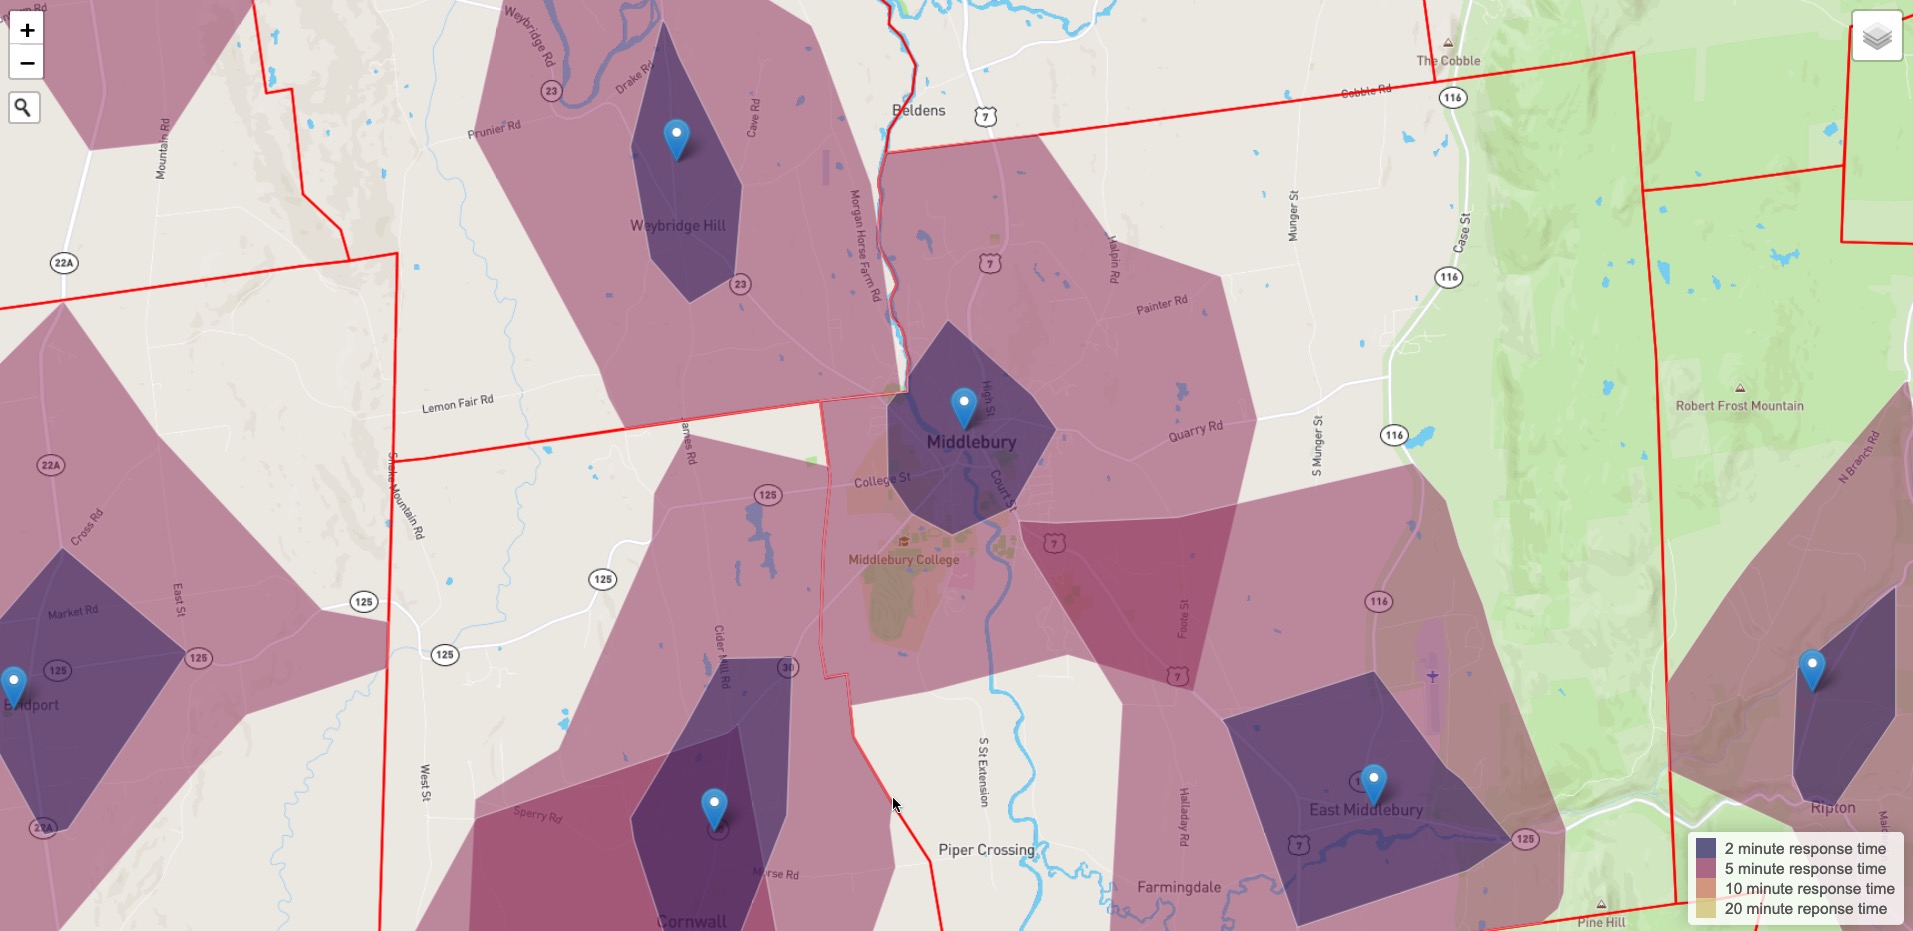
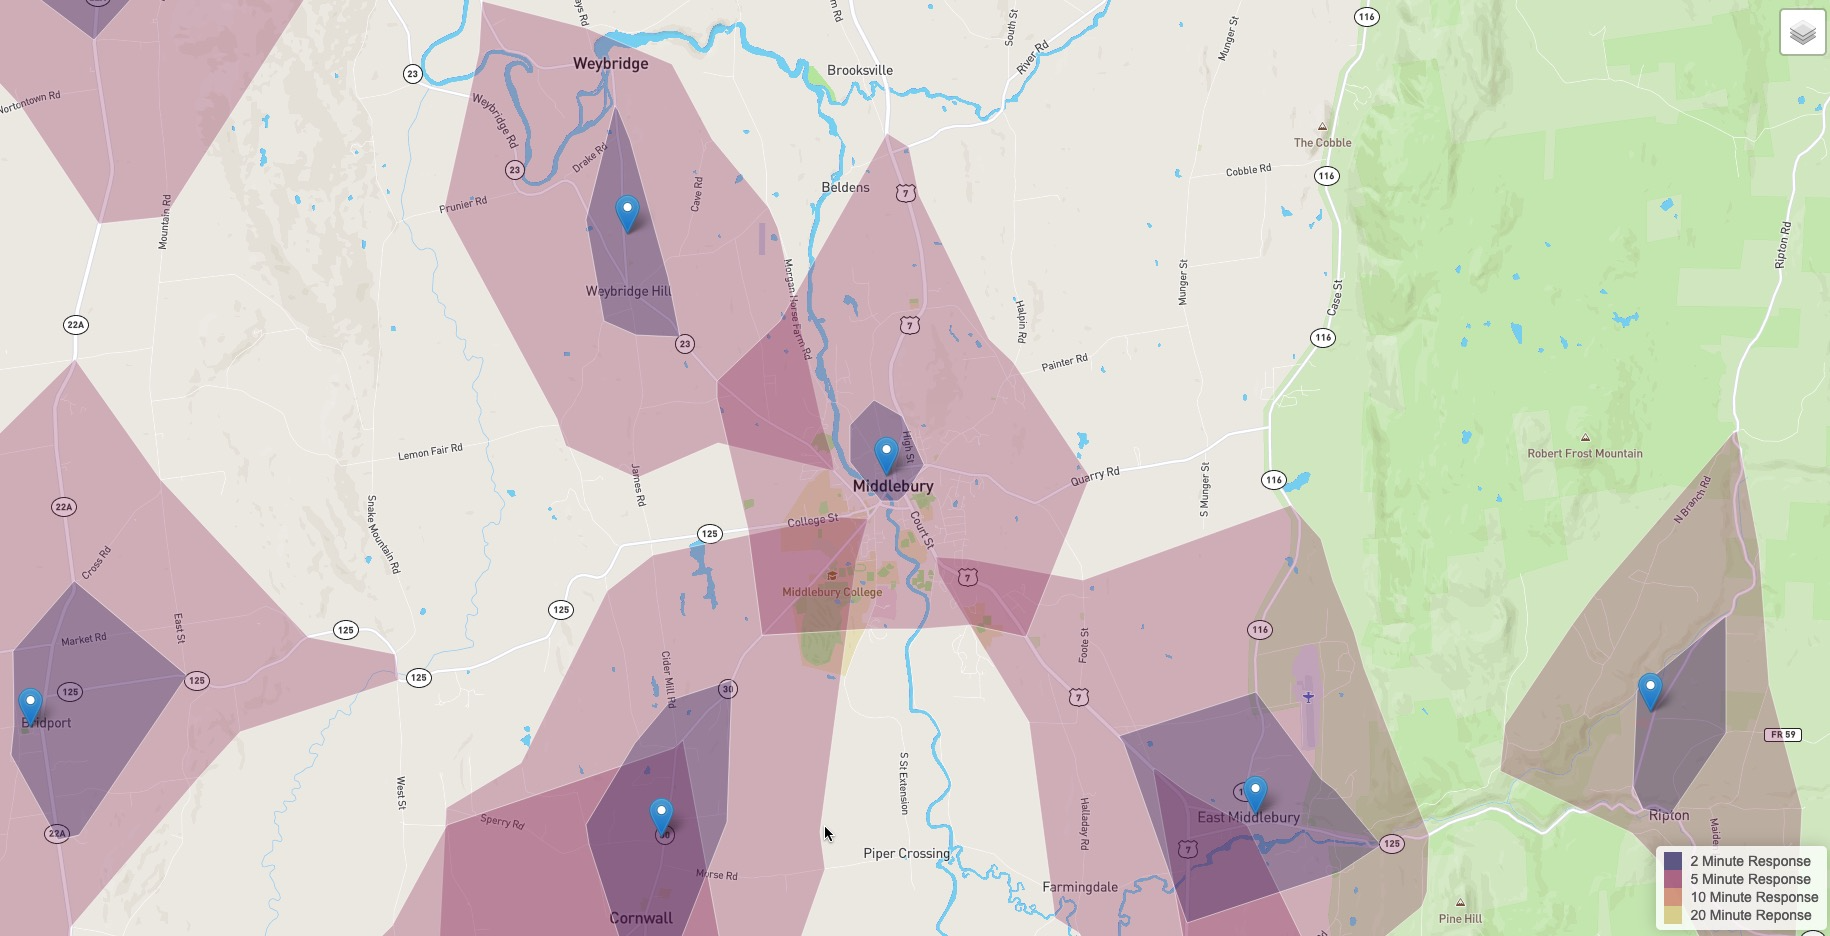
- Utilizing the Geopandas and OSMnx Python packages, we performed network analyses to create multiple spatial polygon layers based on the response times from every fire station. Dijkstra's shortest-path algorithm is performed on the street network graph. Road distances and speed limits are used to calculate the travel time across an edge.
- Using Geopandas and the Fire Dept. Emergency Service Zones dataset, we bounded the response time polygons by their respective service zones to create the Response Times by Service Zone map.
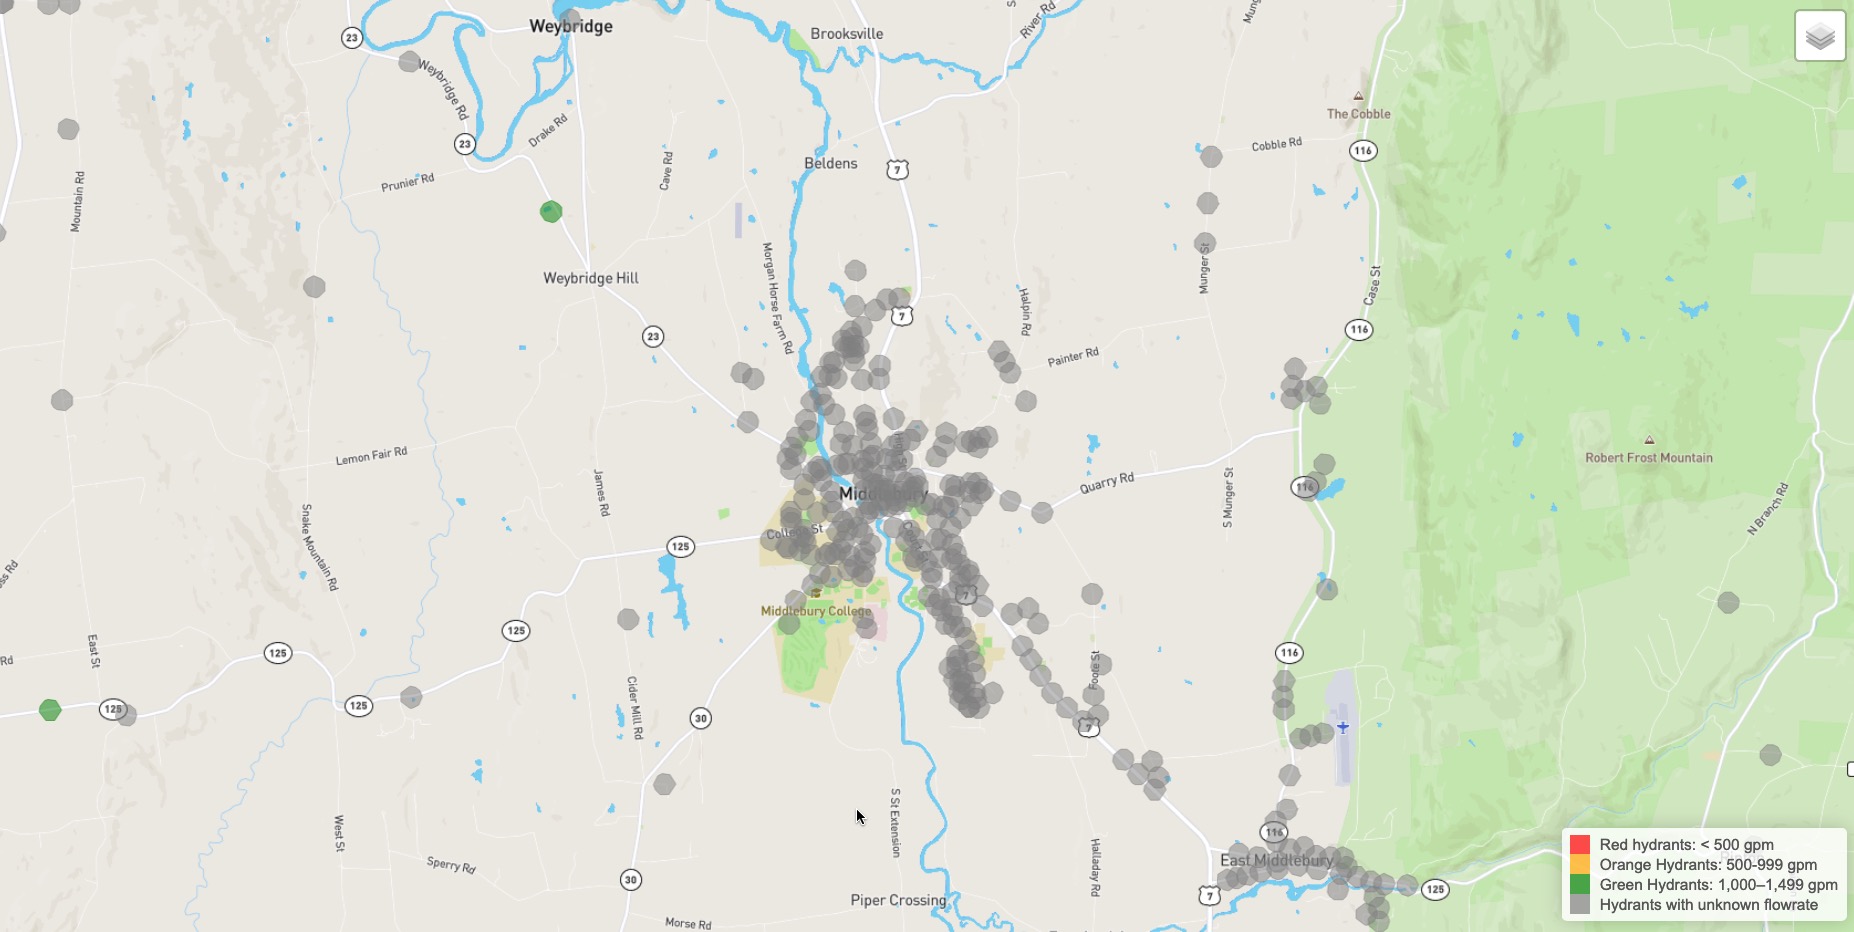
- Again utilizing Geopandas, we created 600 ft. buffer polygons around each fire hydrant in the state.
- Using the Leaflet JS package, we display these polygon layers (geojson files) to an interactive map.
Ethical Implications
These maps offer rough estimates of response times and should not be interpreted as exact (see the Limitations section). A concern of ours is that future homeowners and insurance companies may seek to use our maps as a tool to discriminate between properties located near and far away from fire stations. Consequently, future homeowners may be less likely to purchase homes located outside of certain response time zones, and insurance companies could choose to raise insurance costs for homes in these areas. We recognize these possibilities and remind our users that these maps offer estimates and should be used for public governance, citizen awareness, and emergency planning. Our hope is that regional planning commissions and state emergency planners can use these maps to inform their work and increase coverage across the state.
Links to our code repository and report
Meet the developers
This is a Middlebury College Department of Computer Science Senior Seminar project under the guidance of Prof. Andrea Vaccari.
- John Cambefort
- Middlebury College 2021.5
- jcambefort@middlebury.edu
- Halcyon Brown
- Middlebury College 2021.5
- halcyonb@middlebury.edu